A fishbone diagram, also known as an Ishikawa diagram or cause-and-effect diagram, is a visualization tool used to identify and organize potential causes of a specific problem or effect. Developed by Kaoru Ishikawa in the 1960s, this diagram is named for its resemblance to a fish skeleton, with the problem or effect at the “head” and the contributing factors branching off from the “spine.”
Fishbone diagrams are widely used in various industries, including manufacturing, healthcare, and project management, to help in brainstorming and root-cause analysis of issues, facilitating problem-solving and continuous improvement efforts.
How to make a fishbone diagram
Creating a fishbone diagram is a straightforward process done by hand or using an online template. Follow these steps to create your own:
1. Define the problem: Start by clearly stating the issue or problem you want to analyze. This will be the “head” of the fishbone, represented by a few words or a short phrase.
2. Draw the backbone: Create a long arrow extending from the problem statement. This arrow serves as the central “backbone” of the fishbone diagram.
3. Add main categories: Draw the first set of “bones” branching diagonally from the backbone, right to left. These bones represent the main categories or overarching causes of the problem.
4. Identify sub-causes: For each main category, add smaller bones branching off to represent contributing factors and necessary details related to the overarching causes.
5. Analyze and prioritize: Once complete, your fishbone diagram should provide a comprehensive overview of the potential root causes of the issue. Use this information to rank the causes or determine which are most likely to be the primary contributors to the problem.
Tip: Avoid making your fishbone diagram too complex. Including too many sub-causes or lengthy explanations can lead to confusion and distract from the primary purpose of the exercise. Keep it concise and focused on the most relevant information.
Fishbone diagram templates
Although Microsoft programs do not have built-in fishbone diagram templates, you can easily create your own or use one of the free templates we’ve provided for download below. If you prefer to create your own, follow these steps:
- Open a new document and navigate to the Insert tab. Click on Shapes.
- Start by drawing a long arrow from left to right. This will serve as the backbone of the fishbone. Then, add a text box on the right-hand side of the arrow to represent the head of the fish, where you’ll state the main problem.
- Next, add diagonal lines branching off from the backbone. These lines represent the fish’s ribs, the main contributing factors to the problem.
- Add horizontal lines extending outward from each of the diagonal lines. These horizontal lines represent the potential causes related to each contributing factor.
- Finally, add text boxes to label each component of the fishbone diagram, including the main problem, contributing factors, and potential causes.
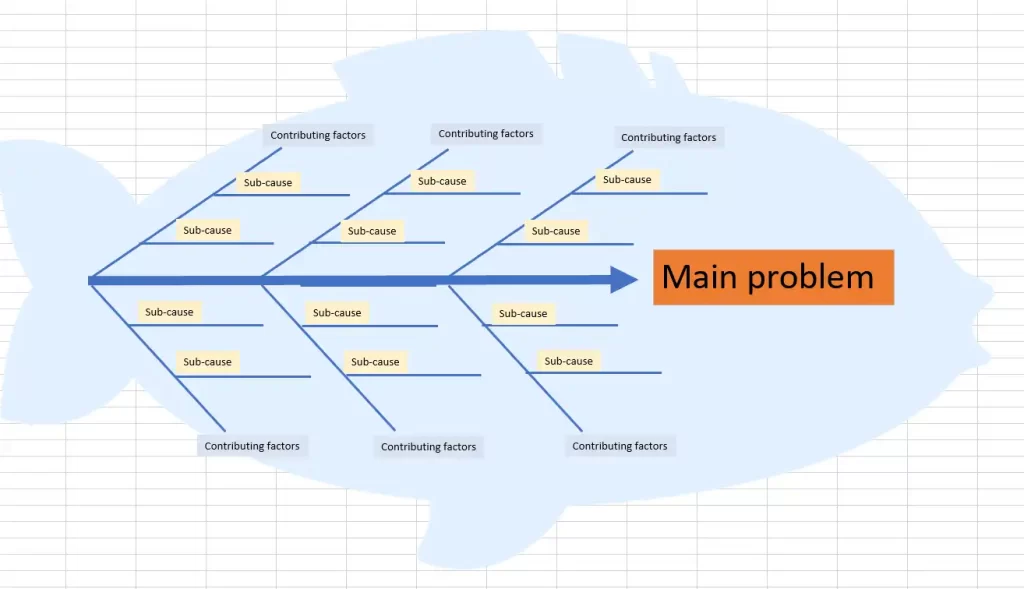
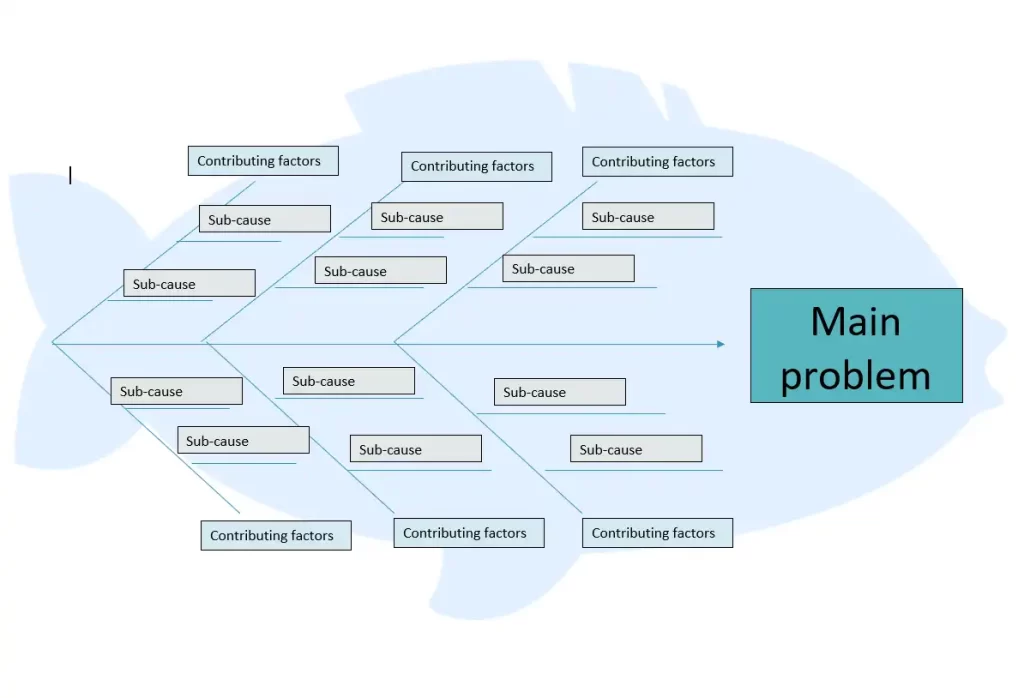
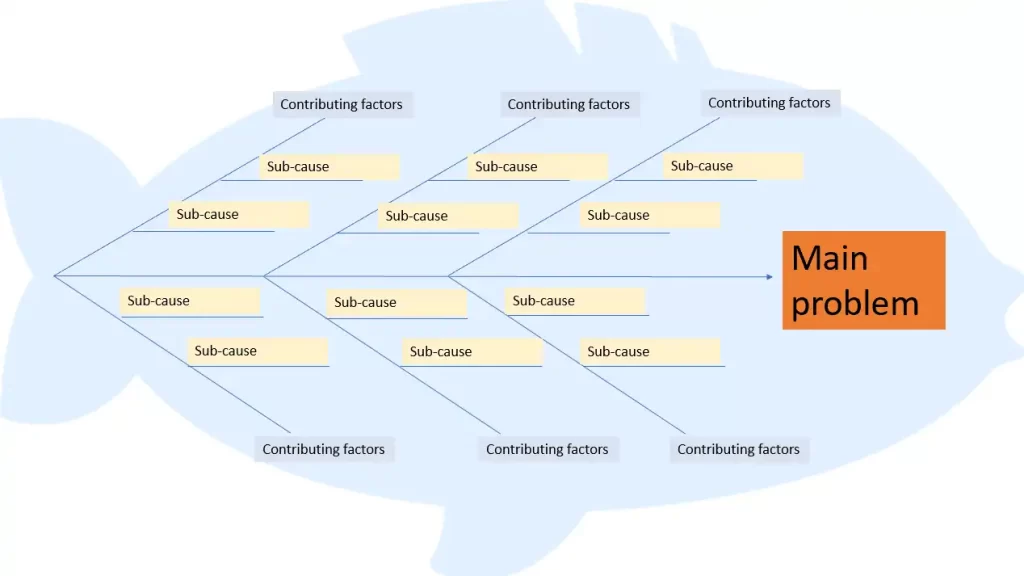
If you prefer to use a pre-made template, we’ve provided blank fishbone diagram templates in the following formats for you to download and fill in:
You can choose the format that best suits your needs and analyze your problem using the fishbone diagram technique. Check out the fishbone diagrams below:
Fishbone diagram template – Google Sheets
Fishbone diagram template – Google Docs
Fishbone diagram template – PowerPoint
Fishbone diagram examples
Fishbone diagrams are versatile tools that can be applied in various contexts, both in academic and professional settings. They are widely used across different industries and departments to identify and analyze the root causes of problems. Here are some examples:
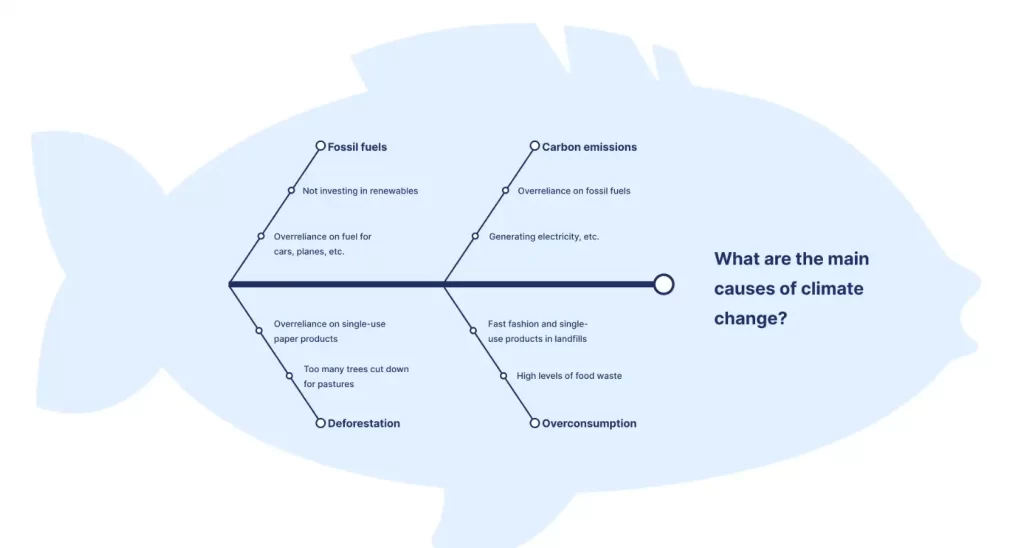
Fishbone diagram example #1: Climate change
To demonstrate the application of a fishbone diagram, let’s analyze a common and pressing issue: climate change. We can identify and organize the main contributing factors to this global problem using a fishbone diagram.
Fishbone diagram example #2: Healthcare and nursing
In healthcare settings, particularly in nursing, fishbone diagrams are frequently employed to investigate complex issues, such as diagnosing patients with unclear symptoms or identifying factors contributing to a decline in patient satisfaction. Let’s use a fishbone diagram to explore the potential causes behind a recent decrease in patient satisfaction scores, as revealed by surveys.
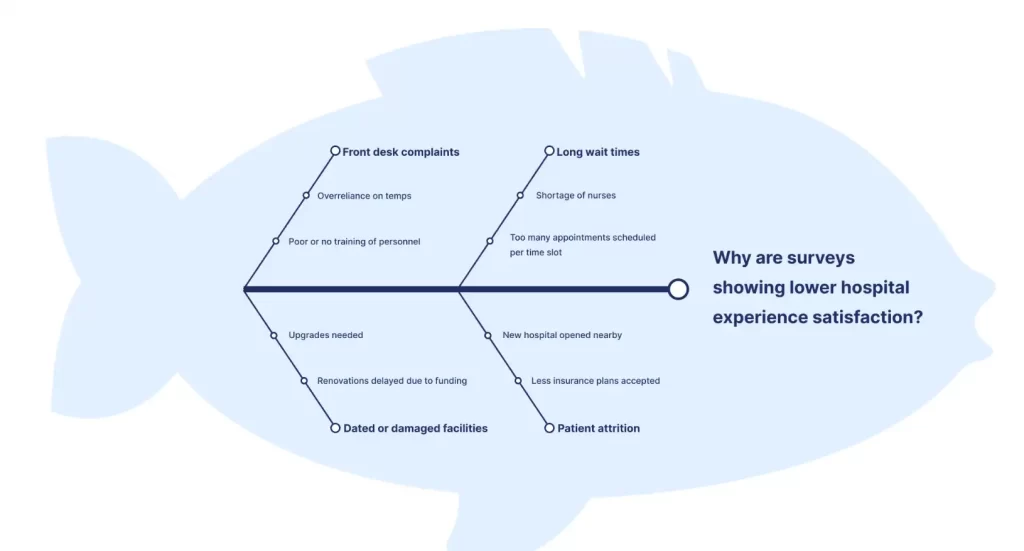
Fishbone diagram example #3: Quality assurance
Quality assurance (QA) professionals often rely on fishbone diagrams to identify and analyze the root causes of various product quality and usability issues. For instance, let’s use a fishbone diagram to investigate a common problem QA teams face: determining the reasons behind a website outage.
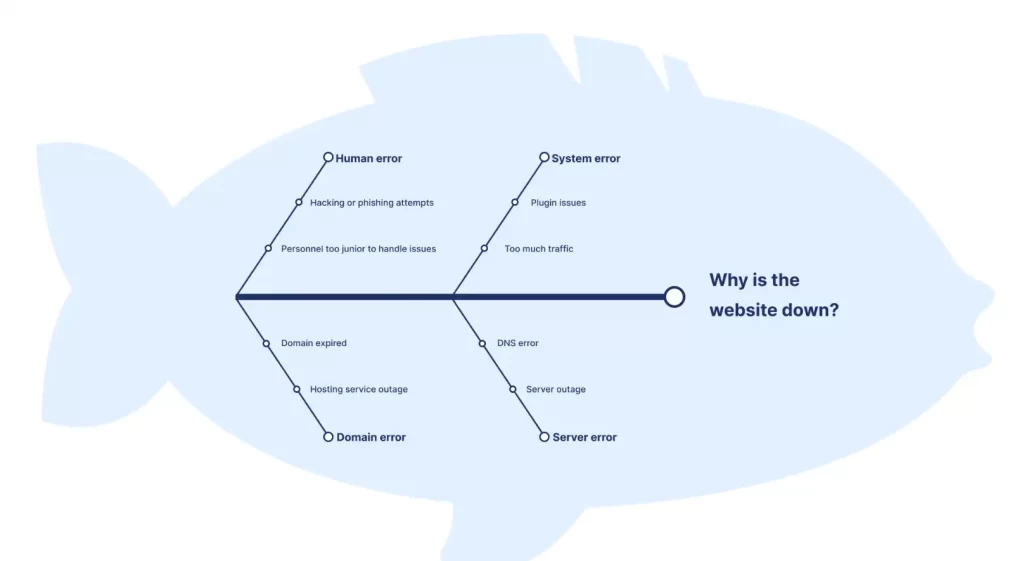
Fishbone diagram example #4: HR
Human resources (HR) professionals can effectively use fishbone diagrams to explore and address complex workforce-related issues. For example, let’s apply the fishbone diagram technique to investigate a common HR challenge: understanding the underlying reasons behind high employee turnover rates within a company.
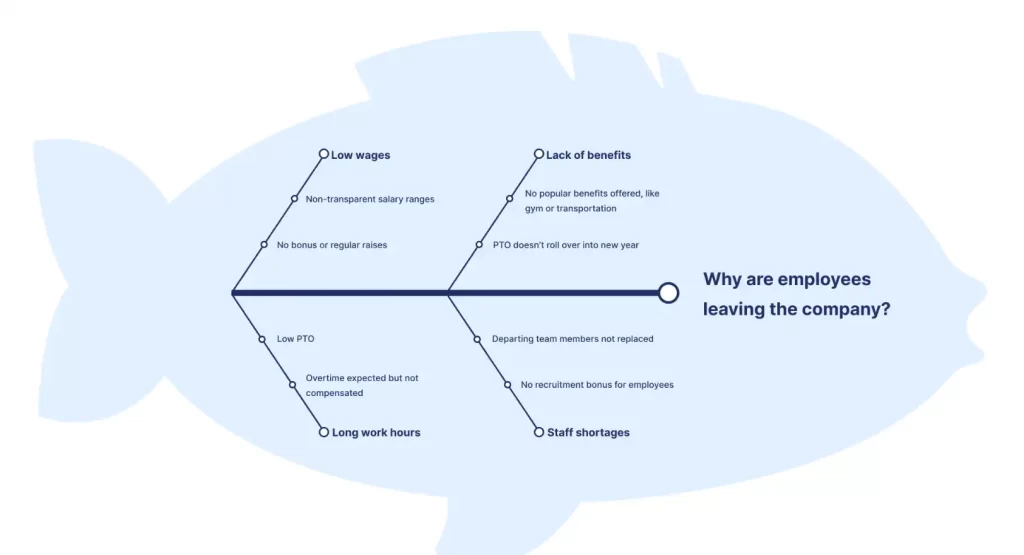
Advantages and disadvantages of fishbone diagrams
Fishbone diagrams offer a structured approach to problem-solving, but users should be aware of some limitations.
| Advantages | Disadvantages |
| Encourages a systematic approach to problem-solving | Can be time-consuming to create and analyze |
| Promotes team collaboration and brainstorming | May oversimplify complex problems with multiple interrelated causes |
| Helps identify root causes rather than symptoms | Relies heavily on the team’s knowledge and expertise |
| Provides a visual representation of cause-and-effect relationships | May not prioritize causes based on their significance |
| Applicable to a wide range of industries and problems | Requires follow-up actions to verify and address identified causes |
| Effective for individual or group brainstorming and mind-mapping | Can lead to incorrect conclusions if wrong assumptions are made |
| Identifies causal relationships and clarifies variable relationships | Best suited for short phrases or simple ideas to avoid clutter |
| Iterative “why” questioning simplifies complex issues and uncovers root problems | Limited to exploratory research phase; cannot provide definitive answers |
